This One Indicator Shows Stocks Are More Overvalued Than Ever
Share |
4min read
There are a few important rules that investors should follow when it comes to making money in stocks. That includes Warren Buffett’s two rules of stock investing. First, never lose money. Second, always remember the first rule.
Then of course there’s the rule to always buy low and sell high, or at least sell higher than you bought. That should go without saying, as no one wants to sell for less than they paid. But in order to do that, you have to know when a particular asset is overvalued or undervalued. How do you do that?
There’s one important method of gauging when markets are overvalued or undervalued, and it too is related to Warren Buffett. It’s known as the Buffett indicator, and is a quick and concise way of determining when stock markets are overvalued.
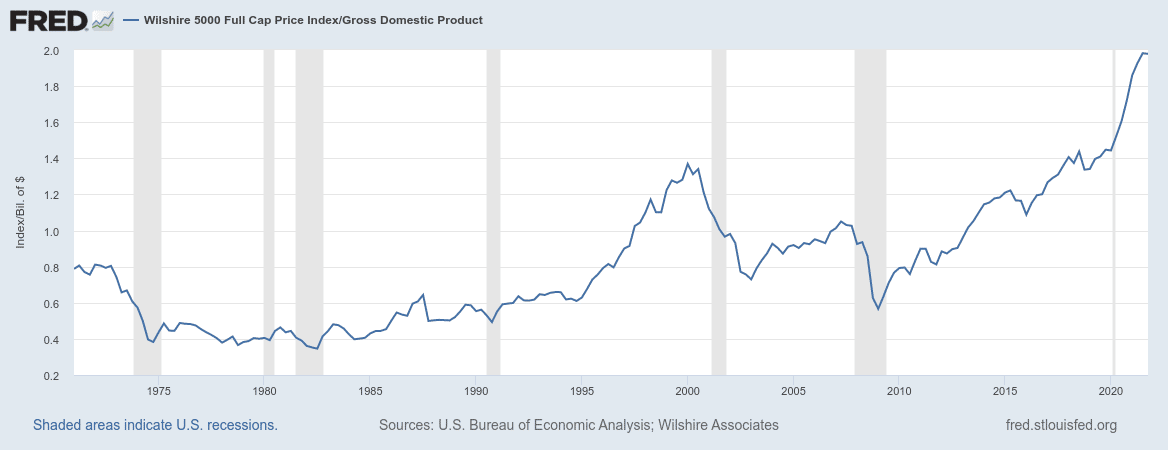
The Buffett indicator is the ratio of the overall valuation of stock markets to United States gross domestic product (GDP). In essence it looks at the relationship between the overall valuation of financial assets and the productivity of the US economy. The higher the ratio, the more overvalued stocks are and the more likely they are to be in a bubble.
The exact numbers of that ratio will naturally vary over time, and the overall trend is for the Buffett indicator to increase over time. That makes sense, as the US economy should be getting more productive, and stock markets have grown accordingly.
Right now the overall trend line is for stock market valuation to be at about 120% of GDP. Anything over that trend line is considered overvalued, while anything under that level is considered undervalued.
As of January 20, 2022, the Buffett indicator was at 202%, a level that’s 68% above the 120% trend line, and one of the highest overvaluations ever recorded. Stock markets have been above that trend line for years, since at least the mid-2010s, but they’ve never been as overvalued as they are today.
What Does This Mean?
The last two times stock markets grew above the trend line were during the dotcom bubble and during the housing bubble. The overvaluation during the dotcom bubble was far greater than the overvaluation during the housing bubble, and in hindsight it’s easy to see that the bubble was underway. But now we can see that an even bigger bubble is building, and the only question now is when it will burst.
We’ve been seeing some indicators of weakness in stock markets recently, with major ups and downs in markets. Overall, markets are also down for the year. Yet it will take a major stock market correction for the Buffett indicator to return to trend.
The question everyone wants to know is whether or not we’ve reached the peak of the Buffett indicator, and whether or not we’re going to start seeing some major declines. Obviously the fear of a market crash is there, but there’s still uncertainty about whether now is the time that markets will see a downturn.
There’s certainly a lot of propaganda in the mainstream media about the “booming economy” and how the US is doing great. Meanwhile the Fed is worrying about inflation, threatening rate hikes, and ending its asset purchases in March. And more and more people are warning of the possibility of a recession.
The Federal Reserve Bank of Atlanta is forecasting that GDP growth in the first quarter of this year will be 0.1%, right on the cusp of an economic contraction. With growth that lackluster, the real numbers could easily be zero or even negative. And the likelihood for continued subpar economic growth or even outright recession continues to rise.
Bank of America analysts have similarly forecast reduced economic growth. And while their projections have declined from 4% growth to 1% growth in the first quarter of the year, they’re not discounting the possibility of negative growth this quarter, or of recession occurring this year.
We’re rapidly entering a period of time in which the growing reality of overvalued stock markets and of a coming recession is becoming more and more apparent to more and more people. The Buffett Indicator is just one example of that, and hopefully more people will become aware of it.
Protecting Yourself Against a Crash
Many of us have been expecting a stock market crash for years. In fact, if you look at the chart of the Buffett Indicator, you’ll see that it has been climbing for years. We have known that at some point stock markets would come crashing back to earth, it was just a matter of when, not if.
The recent gyrations in stock markets, which have seen numerous days with wild swings both up and down, seem to indicate that investors are starting to get wary about the future of markets. And while this week may have been a net wash, investors won’t necessarily be so lucky in the future.
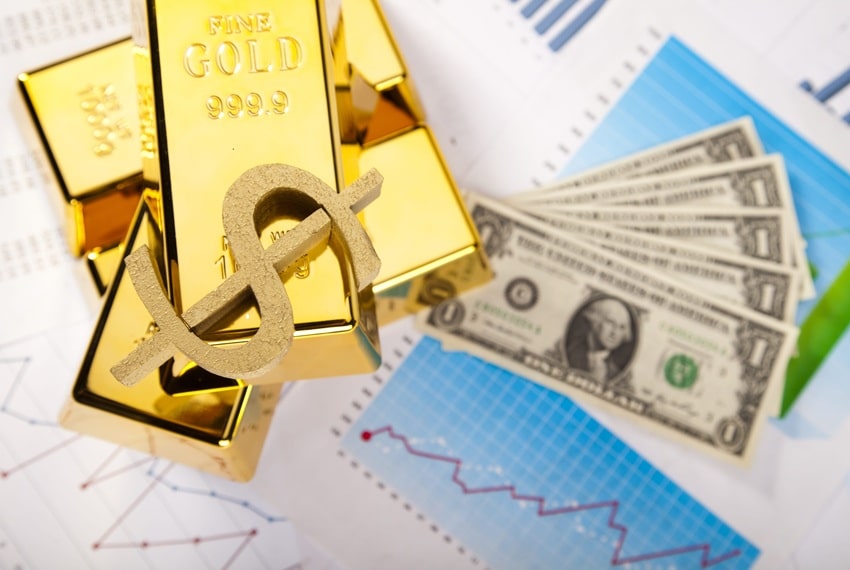
Many thousands of investors have already taken steps to protect their assets against the possibility of a stock market crash, by investing in gold and silver. Gold and silver have helped protect investors for decades, and they’ll continue doing that for decades to come.
Gold and silver saw particularly great gains during the 1970s, a decade marked by stagflation. With high inflation reaching 11% and stock markets that saw nearly no growth, the decade was a difficult one for investors. But gold and silver saw average annualized gains of over 30% that decade.
Gold and silver also saw great gains in the aftermath of the 2008 financial crisis, with gold nearly tripling in price and silver more than quintupling in price. Many investors today expect gold and silver to perform similarly during the next stock market crash.
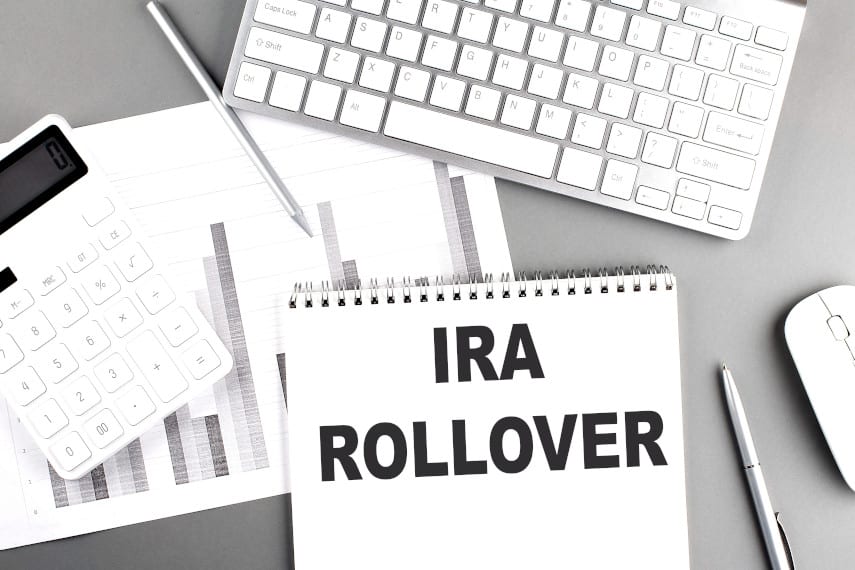
Investing in gold and silver doesn’t have to be difficult, either. With a gold IRA or silver IRA, you can invest in physical gold and silver coins or bars while still enjoying the same tax advantages as a conventional IRA or 401(k). And if you have existing retirement assets in a 401(k), 403(b), TSP, IRA, or similar account, you can roll over or transfer those assets into a gold IRA or silver IRA tax-free.
Time is of the essence, however. With stocks at nearly all-time highs both in absolute terms and in overvaluation, a stock market crash could be right around the corner. If you want to protect your assets with gold and silver, you’ll want to do that before the crash and before your investments lose value. Call the precious metals experts at Goldco today to learn more about how gold and silver can help protect your hard-earned assets.
Gold IRAs are retirement accounts that allow you to help protect your wealth through ownership of physical gold coins or gold bars Gold IRAs can be funded through tax-free rollovers from...
Key Takeaways While precious metals trading has gone digital, the physical storage and delivery system for regulated US futures contracts remains geographically concentrated around the New York...
Key Takeaways The historical inverse relationship between gold prices and real interest rates has frayed Rising Treasury yields are no longer just seen as competition for gold ; they are...
*Applies only to qualified orders. Get up to 5% back in FREE Silver when you purchase $50,000 – $99,999 in Goldco premium coins. Get 10% in FREE Silver when you purchase $100,000 or more in Goldco premium coins. Cannot be combined with any other offer. Additional rules may apply. Contact your representative to find out if your order qualifies. For additional details, please see your customer agreement. Goldco does not offer financial or tax advice regarding the purchase of precious metals.